Picking a new web host is hard. Really hard.
It’s easy to compare plan features such as storage space, bandwidth, and cost, but harder to measure metrics like reliability and speed since they’re rarely calculated or published. That’s when you rely on reviews. But the web hosting review market is flooded with false reviews, claiming unheard of results, just so affiliates can make a quick buck off you if you sign up through their link. As a result, many people may misrepresent the features and functionality of a web host, and it’s hard to get real comparisons.
Additionally, some metrics such as page speed cannot be compared between hosts unless you have two copies of the exact same website running on each. And how often does that happen? Never. At one point I thought I had figured out a way to test host speed easily by comparing cpanel login pages, but that was wrong. I realized if I ever wanted to know for sure which host was the fastest, or who would offer the quickest support when I was in time of need, I’d have to test myself.
So I created my own benchmarks. I purchased active hosting accounts at each of the top web hosting providers, and every month I run tests to see which are performing the best. And I share the results, here, with you.
Some other services test the performance of the host’s corporate home page, but you know that’s not served on the same server you’re going to get (of course they put their front-facing website on beefier servers than their shared servers). Plus each host has diffferent content on their website so there’s no accurate way to measure server performance since you’re comparing apples and oranges.
You won’t find any opinions here. Just facts.
If you have a specific host in mind, check out their benchmarks to the right. Otherwise if you’re unsure where to start, pick qualities that are important to you, such as reliability and speed, and see which hosts are scoring the best.
Below are the 5 areas I thought were most important, along with an explanation of how I measure performance in each of those tests.
Page Speed Test
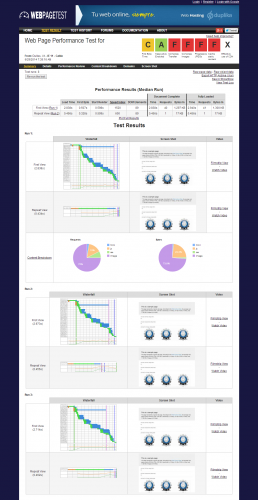
This test is performed by submitting a typical web page served on the host to WebPageTest and recording how long it takes to load. This test web page is 56 KB of HTML, 287 KB of JavaScript, 51 KB of CSS, and 1,128 KB of images (these are typical according to the HTTP Archive). WebPageTest (a 3rd-party, vendor-neutral organization) uses servers located in Virgina and California to measure the page load waterfall in the latest version of Chrome, on a very fast internet connection. The test is ran 5 times each, and the middle (median) result is what is counted from each location. Then the east coast and west coast times are averaged, which should eliminate any bias due to server location. We're interested in first page load, not the repeat/cached view. If you're really interested, I use the 'Load Time' measurement that's returned from WebPageTest for ranking page speed. I still collect other metrics such as TTFB (time to first byte), fully loaded time, and the speed index, in addition to server setting scores which are translated to grades. You can see these detailed values in the "Raw Results." This test is important if your site resembles a typical website and you're concerned about speed (which you should be!) In September 2014 I updated this test to be more accurate, and you'll notice page speeds were a bit higher before then. The test used to be run only 3 times from one location using a simulated cable internet connection on Internet Explorer 11. The new method provides much more consistent results.
See the results of this month’s Page Speed Test.
Uptime Test
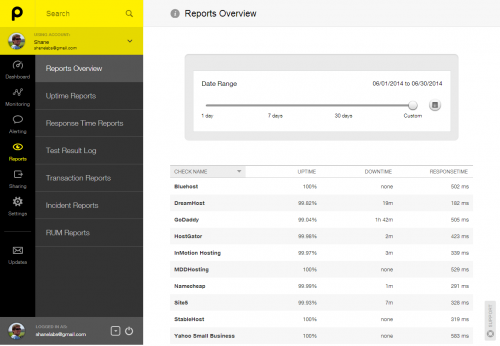
I use Pingdom to report website uptime. Pingdom is configured to make an HTTP request to the host every minute, and report if it is unreachable. It'll also report an error if the host takes longer than 30 seconds to respond (Yes, that's not actually down, but if your site takes that long to respond it is unusable in my opinion). Pingdom performs this test from at least 3 servers worldwide, and reports a problem if 2/3 servers do no respond. This test is important if you are concerned about the reliability of your web host (this is important!)
See the results of this month’s Uptime Test.
Support Response Test
This test is performed by submitting a typical web page served on the host to WebPageTest and recording how long it takes to load. This test web page is 56 KB of HTML, 287 KB of JavaScript, 51 KB of CSS, and 1,128 KB of images (these are typical according to the HTTP Archive). WebPageTest (a 3rd-party, vendor-neutral organization) uses servers located in Virgina and California to measure the page load waterfall in the latest version of Chrome, on a very fast internet connection. The test is ran 5 times each, and the middle (median) result is what is counted from each location. Then the east coast and west coast times are averaged, which should eliminate any bias due to server location. We're interested in first page load, not the repeat/cached view. If you're really interested, I use the 'Load Time' measurement that's returned from WebPageTest for ranking page speed. I still collect other metrics such as TTFB (time to first byte), fully loaded time, and the speed index, in addition to server setting scores which are translated to grades. You can see these detailed values in the "Raw Results." This test is important if your site resembles a typical website and you're concerned about speed (which you should be!) In September 2014 I updated this test to be more accurate, and you'll notice page speeds were a bit higher before then. The test used to be run only 3 times from one location using a simulated cable internet connection on Internet Explorer 11. The new method provides much more consistent results.
See the results of this month’s Support Response Test.

